ABSTRACT
The legal amount of emissions that vehicles with spark ignited engines are allowed to produce are steadily reduced over time. To meet future emission requirements it is desirable to make the catalytic converter work in a more efficient way.
One way to do this is to control the air-fuel-ratio according to the oxygen storage level in the converter, instead of, as is done today, always trying to keep it close to stoichiometric. The oxygen storage level cannot be measured by a sensor. Hence, a model describing the dynamic behaviors of the converter is needed to observe this level. Three such models have been examined, validated, and compared.
Two of these models have been implemented in Matlab/Simulink and adapted to measurements from an experimental setup. Finally, one of the models was chosen to be incorporated in an extended Kalman filter (EKF), in order to make it possible to observe the oxygen storage level online.
The model that shows best potential needs further work, and the EKF is working with flaws, but overall the results are promising.
MODEL VERIFICATION METHOD
The models described in chapter 4, 5 and 6, and the online adaption strategy in chapter 8 has been implemented in Matlab/Simulink. The measurements used to adapt and validate the models have been collected from an experimental setup.
Data
The data was collected at three operating points, which can be seen in table 2.1. Two sets of data were collected at every operating point, one to use when calibrating the models, the estimation data, and the other to use when validating the models, the validation data.
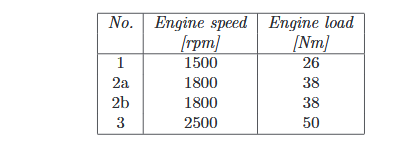
Table 2.1: Operating points where measurements were taken
At operating point number 2, two estimation and validation data sets were collected with a slight difference in the estimated position of the stoichiometric point. The switch-type λ-sensor values from these two data sets can be seen in figure 2.1. The dotted lines in the figure represent the rich and lean levels. This shows the great sensitivity to a very small change in the point where the AFR is assumed to be stoichiometric.
The measured wide-range λ before the catalytic converter at operating point number 3 can be seen in figure 2.2. The measurements in the other three sets of data look similar to this one. Notice that the wide-range λ-sensor before the catalytic converter suffers from a bias and show measurements between 0.98 and 1.04, even though the real λ -value switches between 0.97 and 1.03.
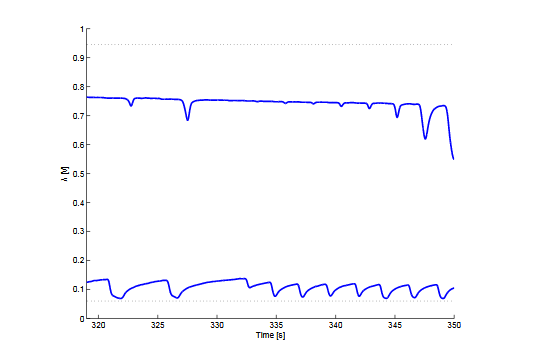
Figure 2.1: The filtered measurements from the switch-type λ-sensor after the catalytic converter
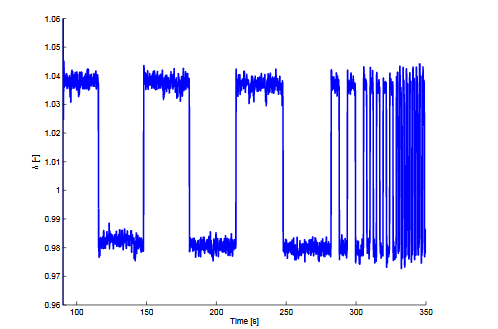
Figure 2.2: The filtered measurement from the wide-range λ-sensor before the catalytic converter, in one of the estimation data sets
INTRODUCTION TO EMISSIONS AND CATALYTIC CONVERTERS
Cars are equipped with catalytic converters in order to reduce pollutants that have negative consequences on both humans and the environment. In order to reduce the harmful species the catalytic converter contains noble metals that promote reactions to take place. These re-actions are necessary for the reduction of the dangerous species in the exhaust gas.
Combustion Engines and Emissions
A combustion engine takes air and fuel as input and produces power and emissions. The fuel is based on hydrocarbons (C α H β ). A schematic picture of a combustion engine can be found in figure 3.1. When the engine is running stoichiometrically ( λ = 1) the fuel and oxygen in the air are in perfect proportion to each other and theoretically the emissions consists only of carbon dioxide, water vapor and nitrogen, see (3.1).
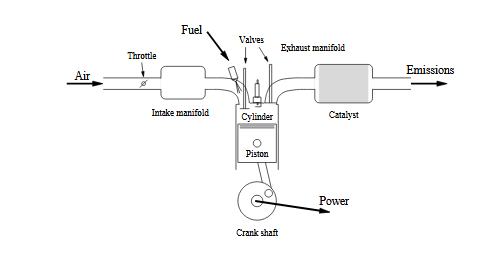
Figure 3.1: Schematic picture of an Engine
MODEL A-A STORAGE DOMINATED MODEL WITH REVERSIBLE CATALYST DEACTIVATION
A combustion engine takes air and fuel as input and produces power and emissions. The fuel is based on hydrocarbons (C α This chapter describes a model presented by James C. Peyton Jones. It is empirical and it is assumed that the dynamics of the catalytic converter are dominated by oxygen storage in the converter and reversible catalyst deactivation.
These are not assumed to change over the catalytic converter’s spatially distributed nature. Hence, there are two state space variables to describe these two phenomena. This is based on the observation in that all gas components respond to input changes over a similar time-scale. Which shows that the process is dominated by the relatively slow dynamics of gas storage and re-lease, and that the other kinetics occur over a much shorter, and less significant, time-scale.

Figure 4.2: Block diagram of the catalytic converter model and the λ converter

Figure 4.3: The filtered measured and simulated switch-type λ-valuesfrom the four operating points
MODEL B-A MODEL CONSISTING OF ONE NONLINEAR INTEGRATOR
This model is presented by Mario Balenovic. The model is basically a nonlinear integrator with one state representing oxygen coverage, one parameter which gives an indication on the converters’ storage capacity and a function that represents the relative conversion. The model has one input and one output, the wide-range λ-sensor signals before and after the catalytic converter, respectively.
MODEL C-A SIMPLIFIED PHYSICAL EXHAUST GAS AFTER TREATMENT MODEL
This model has been developed by Theophil Sebastian Auckent haler and is presented. The model is a physical model of the exhaust gas after treatment system, which includes a reversible wide-range λ-sensor model before the converter, a switch-type λ-sensor model after the converter, and of course a TWC model.
The model is based on reaction kinetics of a small number of key gas components and reactions together with the dynamics of gas storage on the converter surface. The spatially distributed nature of the converter is approximated by a lumped parameter model. The ageing of the TWC is represented by the parameter describing the storage capacity, hence the storage capacity is the only parameter that is assumed to change over time.
Model
The model consists of three modules, see fig 6.1. The input to the model is the wide-range lambda sensor signal up- stream of the TWC, the exhaust mass flow and temperature, and the output is the switch-type lambda sensor signal.

Figure 6.1: Block diagram of the complete model
RESULTS AND DISCUSSION
The purpose of this thesis was to examine the possibilities to model the dynamics of a catalytic converter for control purposes. During the search for existing models, three promising models were found and they have been investigated in this thesis.
All three models have the wide-range λ as input and have at least one state that in some way describes the oxygen storage level, and they all consider catalyst deactivation. The three models are fairly simple and needs online adaptation due to ageing of the converter. A short summary of the most important features of the models are presented below. Further comparison of the models is given in chapter 7.
FUTURE WORK
First of all, more time should be invested in obtaining parameter values for Model C that describe the dynamics more accurately, e.g by using other estimation algorithms or investigate if any simplifications like the ones in section 6.2.1 can be done. When satisfying results have been obtained, the next step is to solve the problems in the extended Kalman filter and finally, test the filter online with a control strategy. Since the storage capacity is adapted online the filter can be used for diagnostic purposes as well.
As described in previous chapters, the reactions taking place in the converter make the gas composition change dynamically. As the gas composition has great impact on the sensors’ behavior, further investigation of the λ -sensors are highly recommended, especially if a wide-range λ-sensor is to be used. Additionally, the effects of sensor ageing should be examined.
Source: Linköping University
Authors: Jenny Johansson | Mikaela Waller
>> More Electrical Mini Projects for 3rd Year B.E/B.Tech Students
>> 100+ Easy Electronics Projects for Engineering Students
>> Electronics Mini Projects for ECE
>> Automobile based Matlab Project Topics with Free Base Papers Downloads
>> 200+ Matlab Projects based on Control System for Final Year Students
>> 80+ Matlab Projects based on Power Electronics for Final Year Students
>> More Matlab Mini Projects for Final Year Students