ABSTRACT
This report outlines the design and implementation of a digital guitar effects unit and amplifier. The main portion of this project consisted of the digital equalizer and effects. Several commercial equalizers were researched in order to decide the typical frequency bands and average amount of bands total. Eventually 8 bands were selected. A range of approximately 20Hz-3kHz was chosen based on test data of guitar signals. Popular effects that were incorporated in this project include Distortion, Echo, Reverb, Chorus and Flanger. The digital processor chosen was a Texas Instruments c6713 floating point processor. Designs for the various filters were done in MatLab and implementation on the processor was done through TI’s Code Composer Studio.
BACKGROUND
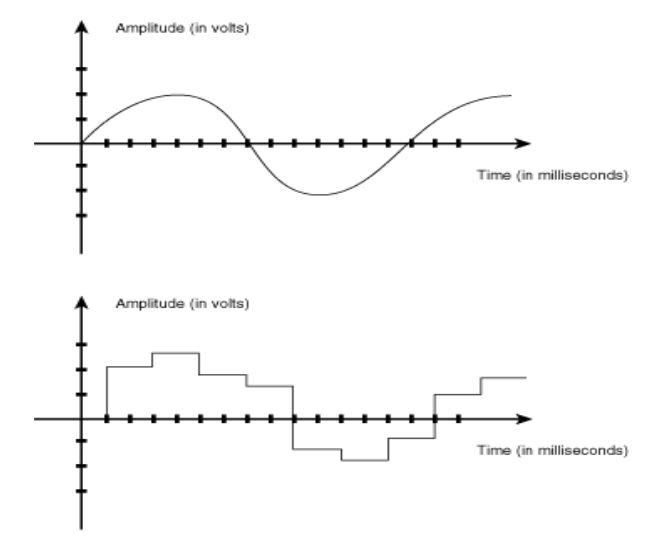
Figure 1: Analog vs Digital signal
Signal processing can be achieved in both the analog and digital domains. The difference between analog and digital is that analog waveforms are continuous in both time and amplitude while digital is discrete in both respects.
REQUIREMENTS
Functional Requirements
-amplification of audio signal with controllable gain
-Digital signal processing to provide filtering and modulation of audio signal
-user controlled Equalizer (EQ)
-distortion
-presets (Reverb, Echo, Flanger, Chorus, and Auto-Wah)
DESIGN APPROACH ALTERNATIVES
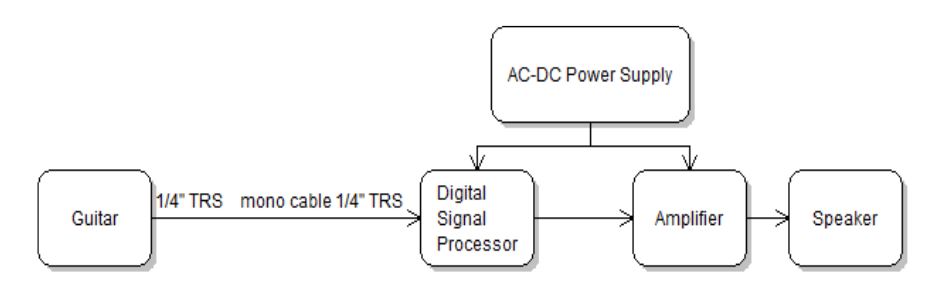
Figure 2: Blackbox Diagram
The major design choice lies in the implementation of the digital equalizer. There are two main alternatives to consider when designing the equalizer. One met hod is Frequency Sampling (FIR) which makes controlling the magnitude response easy by directly changing the |H(F)| values at certain frequency. The second method is using an individual band pass filter (IIR) for each frequency band. This method benefits in providing the designer more control over the actual range of each band by being able to select the appropriate cutoff frequencies.
PROJECT DESIGN
This system will have an LCD interface that displays the current effect state of the DSP. A single button will be used to cycle through the various effect states. The LCD will also display the magnitude response of the EQ filter. Two buttons will be used to cycle through the various bands and two other buttons will be used to control the gain/attenuation.
PHYSICAL CONSTRUCTION AND IMPLEMENTATION
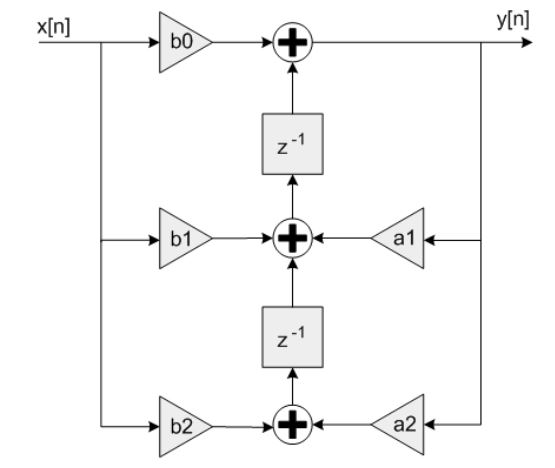
Figure 7: Signal Flow graph for the Direct Form II Transposed Difference Equation
After each filter was simulated, the resulting coefficients were coded to create the filters on the DSP. The difference equation for each filter was coded in using the Direct Form II Transposed structure for 2nd order filters. This form of the difference equations cuts down the number of delays in half by combining the output and inputs that contain the same delayed index such as x[n-1] and y[n-1].
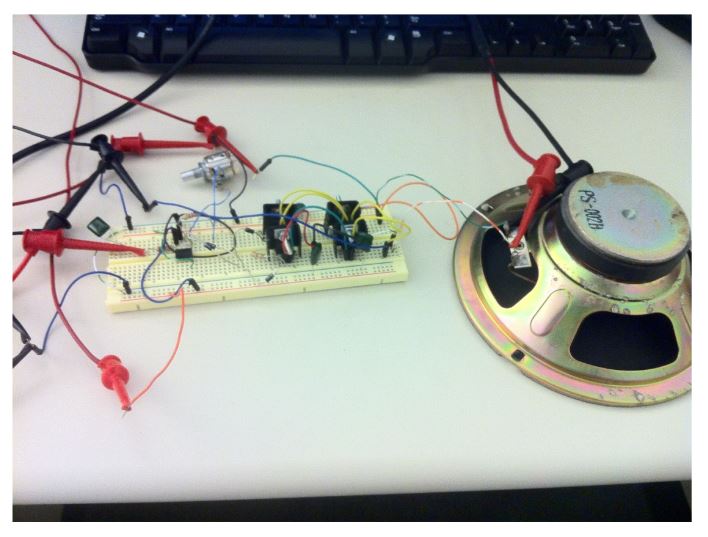
Figure 14: Power Amplifier and Speaker
The analog circuits were intended to be mounted on printed circuit boards. The DSP development board along with analog circuits will be packaged in a wooden crate speaker box. Unfortunately the analog circuits were not packaged as initially proposed and instead were just tested and prototyped on bread boards. The amplifier circuit is shown in Figure 14. Final packaging was not achieved.
INTEGRATED SYSTEM TEST RESULTS
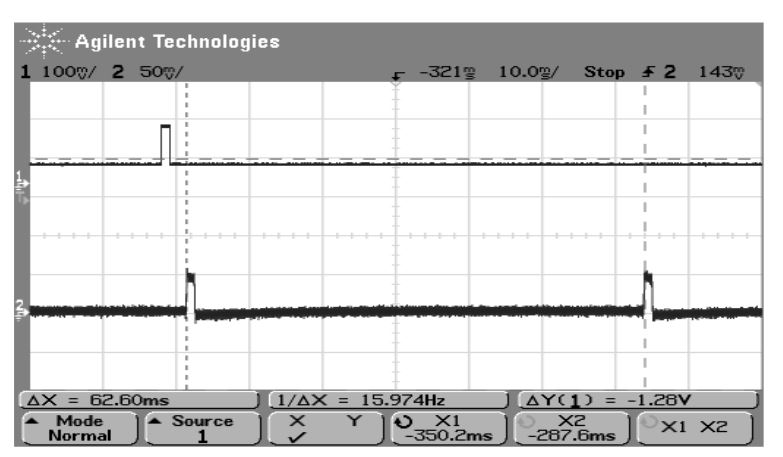
Figure 15: Input and Output waveforms displaying the delay time used for Echo effect
A similar issue was found when implementing the reverb effect. Reverb as stated earlier uses a feedback system in which the output is fed back into itself. This automatically created an instance of overflow. Instead of using a overflow detector as was done previously, the delayed output was simply type cast to a lesser data type; in this case an Int16 instead of the output’s normal double.
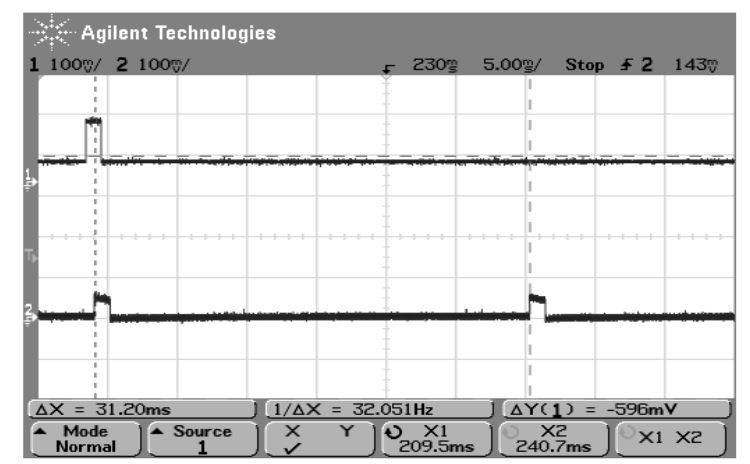
Figure 18: Input and Output waveforms displaying the delay time used for Echo effect
Secondly, each filter for the equalizer was tested individually. An oscilloscope and function generator was used to achieve the frequency response of each filter. The intervals of measured frequency were decreased as the response app roached the center or cutoff frequency, in order to get a more accurate representation of the actual cutoff.
CONCLUSION
The main portions of the project were completed, such as the digital equalizer and effects and amplifier. However they weren’t packaged together as intended. During the senior project exhibition a Roland Micro Cube amplifier was used to instead of the designed product. Also the DSK6713 was powered by its own power adapter. The DSK does have through holes where an external supply can be applied with voltages of 3.3V, 5V and 12V but I did not want to risk damaging the board.
Originally an LCD was going to be used to display the response of the equalizer as well as what effect was currently applied. Issues with processing speed caused the display to be excluded from the project. The data sheet gives a normal clock speed for the HD44780 as 270 kHz while the c6713 DSP ran at a speed of 225 MHz. In order for the LCD to process the data correctly large delays were required which interfered with the DSP’s real time processing.
Source: California Polytechnic State University
Author: San Luis Obispo
>> 50+ Matlab projects for Digital Image Processing for Engineering Students
>> More Matlab Projects on Audio Processing for Final Year Students
>> 200+ Matlab Projects based on Control System for Final Year Students
>> More Matlab DSP Project Ideas for Final Year Students