ABSTRACT
Synthetic Aperture Radar (SAR) systems generate two dimensional images of a target area using RF energy as opposed to light waves used by cameras. When cloud cover or other optical obstructions prevent camera imaging over a target area, SAR can be substituted to generate high resolution images. Linear frequency modulated signals are transmitted and received while a moving imaging platform traverses a target area to develop high resolution images through modern digital signal processing (DSP) techniques.
The motivation for this joint thesis project is to design and construct a scaled SAR system to support Cal Poly radar projects. Objectives include low-cost, high resolution SAR architecture development for capturing images in desired target areas. To that end, a scaled SAR system was successfully designed, built, and tested. The current SAR system, however, does not perform azimuthal compression and range cell migrati on correction (image blur reduction). These functionalities can be pursued by future students joining the ongoing radar project.
The SAR system includes RF modulating, demodulating, and amplifying circuitry, broadband antenna design, movement platform, Lab View system control, and MATLAB signal processing. Each system block is individually described and analyzed followed by final measured data. To confirm system operation, images developed from data collected in a single target environment are presented and compared to the actual configuration.
SYSTEM INTRODUCTION
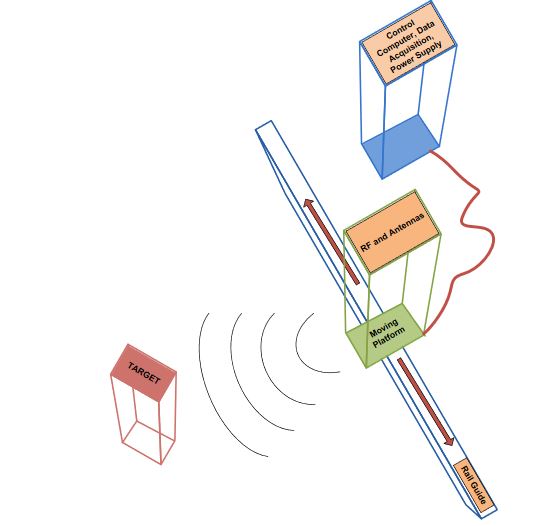
Figure 2-1: High Level Sub-system Sar Diagram
System specifications were selected to simplify the RF section; a 2 GHz center frequency was chosen due to component availability and existing measurement equipment during implementation. To reduce antenna sub-system complexity, a single antenna with a duplexer was replaced with two antennas, one for transmit and one for receive.Figure 2-1 illustrates the overall system, which defines major sub-systems and defines the remaining chapters.
LAB VIEW SYSTEM AUTOMATION
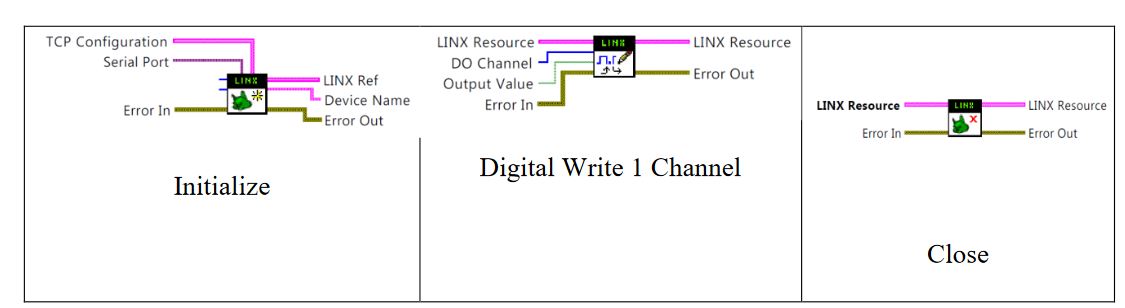
Figure 3-4: Linx Sub-vi Wiring Diagrams
LINX is an open source API (application program interface) for interfacing micro-controllers with LabView. It provides microcontroller-stored firmware and sub-VIs for larger projects. The sub-VIs open a COM port for microcontroller communications, digital and analog pin control, and advanced micro-controller functions. For this project, only COM port access and digital pin control microcontroller functions are required.
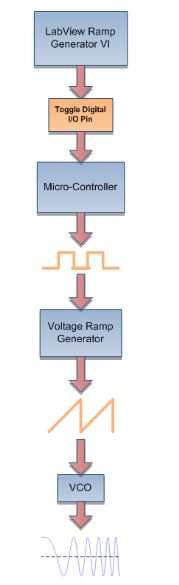
Figure 3-6: Chirp Generation Block Diagram
The SAR system microcontroller’s primary functions are to trigger chirp pulse transmissions and to control RF and antenna system rail position via stepper motor commands. Figure 3-6 summarizes LabView and micro-controller interactions to generate the chirp signal. To begin chirp pulse transmission, the LabView VI toggles the voltage ramp generator circuit microcontroller pin.
POSITIONER SYSTEM
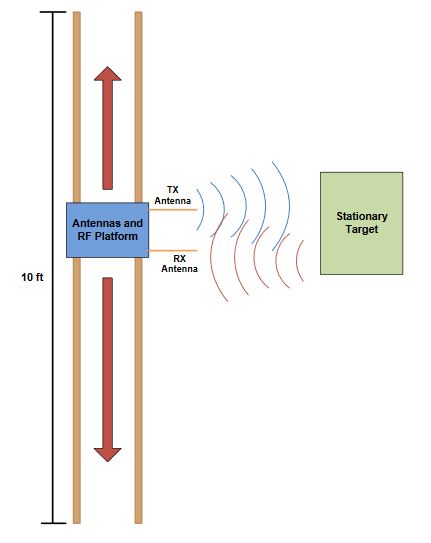
Figure 4-1: Movement Guide Rail Geometry
Three designs were developed. All three designs follow the Figure 4-1 diagram, but differ in platform-driving motor techniques and platform-guide rail contact methods. The main guide rail base includes two parallel 10’x 2” x4” beams. The beams were mounted on a 3’x3’ square of ¾ ” thick plywood on both ends to balance the guide rails and platform.
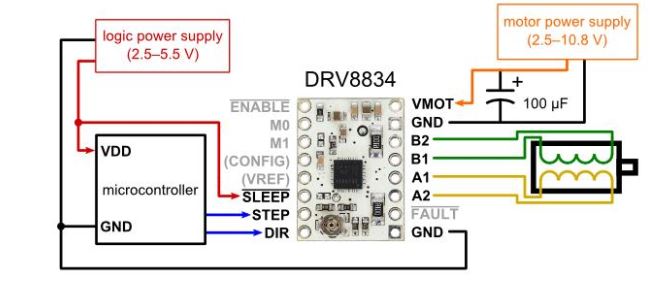
Figure 4-5: Tidrv8834 Breakout Board Wiring Diagram, Stepper Motor Control
The Texas Instruments DRV8834 stepper motor driver was designed to drive low voltage (3V, 2A) stepper motors. Figure 4-5 illustrates the required connections using the TIDRV8834 motor control IC mounted to a breakout board for system integration. The micro-controller toggles the IC digital logic pins while the IC is also connected to a high current capacity (2.5A) power supply and the stepper motor.
ANTENNA DESIGN
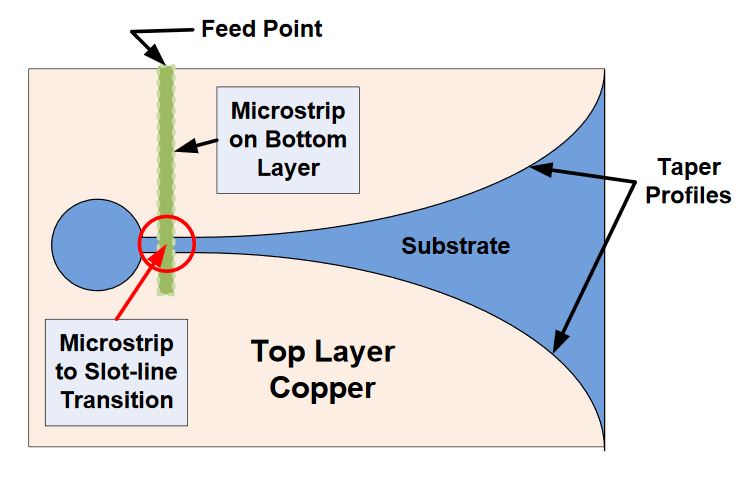
Figure 5-1: Vivaldi Flare Geometry
The Vivaldi flare is a linearly tapered slot antenna (LTSA). Due to their flared geometry, see Figure 5-1, these antennas maintain efficient radiation and constant beam-width over a wide frequency range.
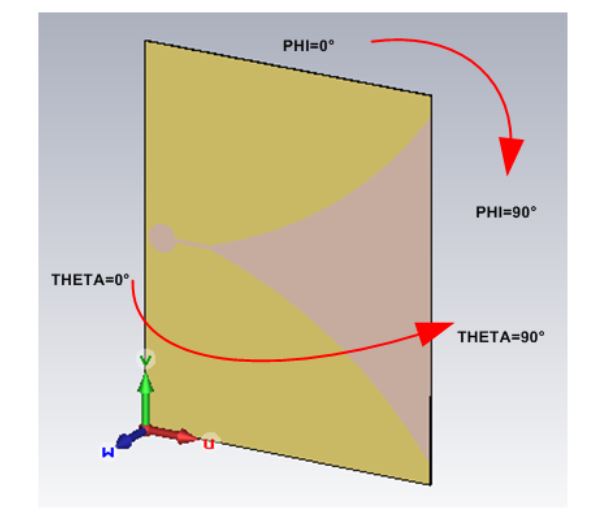
Figure 5-9: Vivaldi Flare Radiation Pattern Coordinate System: E-plane (Phi Scan) and H-plane (Theta Scan)
While measured results shows 2 dB fluctuations in peak gain across the band (consistent between the antenna pair), the overall gain trend follows simulated expectations with a maximum difference of 3.5 dBi at 2.1 GHz. The anechoic chamber was also used to measure fabricated antenna radiation patterns at 2 GHz. Figure 5-9 shows the antenna geometry and coordinate system for the measured radiation pattern.
RF FRONT-END
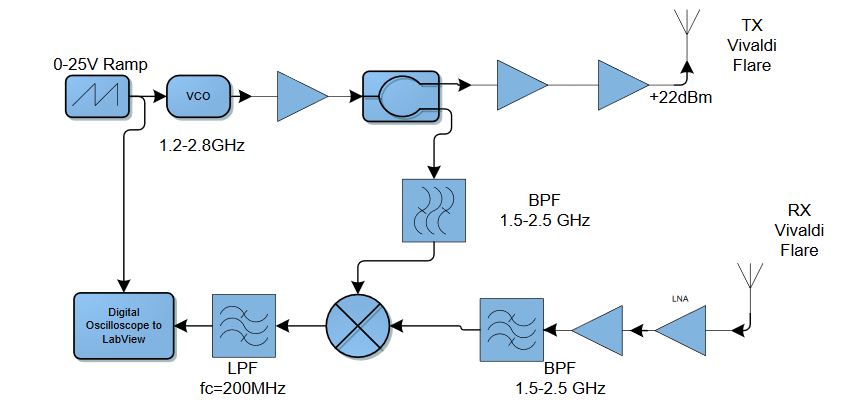
Figure 6-1: RF Signal Chain Block Diagram
The voltage ramp generating circuit is connected to the Mini-Circuits ZX95-2800-S+ VCO to produce a chirp signal with frequency range 1.2 0 to 2.95 GHz. The VCO drives a micro-strip power splitter connected to a band pass filter and two Mini-Circuits ZX60-V63+ amplifiers to create sufficient transmit power (22 dBm).
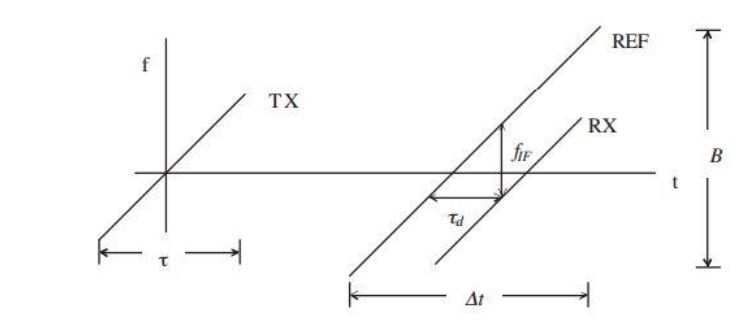
Figure 6-3: Pulse Compression Timing Diagram
The left side of Figure 6-3 defines the transmitted waveform (TX) with pulse duration τ over time (t) vs. frequency (f). This pulse is reflected from an object and received. The received waveform (RX), denoted REF for reference, is received τ d seconds after the beginning of the TX pulse is transmitted.
SIGNAL PROCESSING
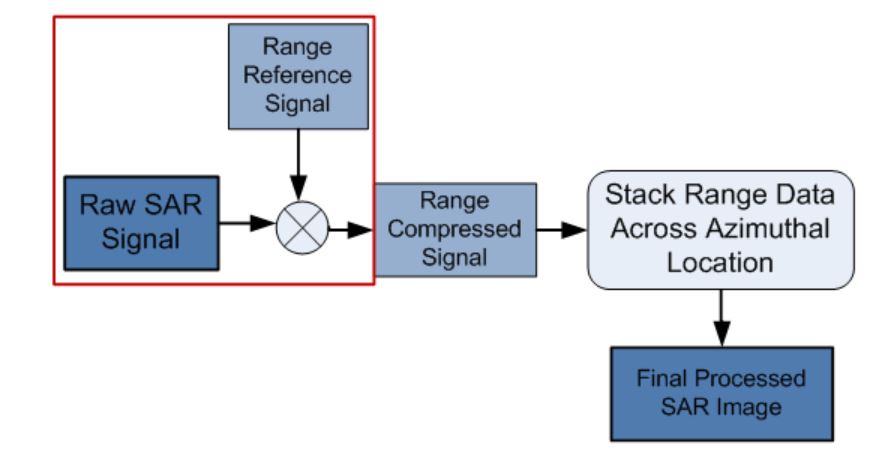
Figure 7-1: Range Compression Signal Processing Block Diagram
The red box area in Figure 7-1 accomplishes hardware-based range compression as described in section 6.1 above. Following range compression, the received signal at each location along the rail is sequentially arranged along the azimuthal dimension to produce the final image, see Figure 1-5.
RESULTS
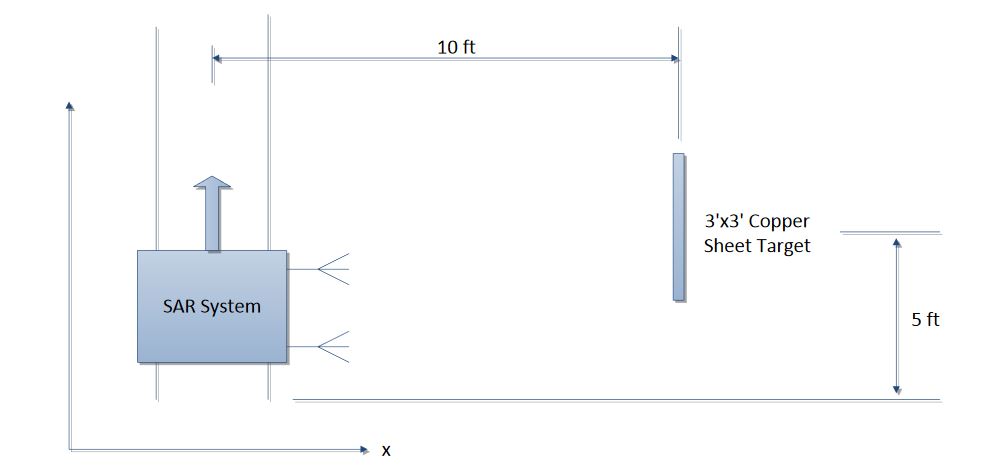
Figure 8-1: Target Scene Geometry; Sheet Target 10 Ft F Rom Radar, 5 Ft From Edge of Rail Motion
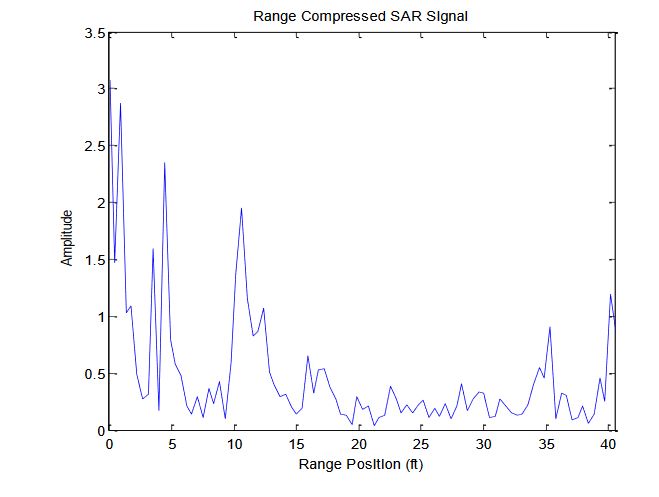
Figure 8-2: Raw Range Data Collected 5 Ft Across T He Rail With 3×3’ Target at 10 Ft Range Distance
With in the target scene shown in Figure 8-1, 50 data points were collected at 2.4” rail increments. At t he 25th data point, the radar platform is centered in the rail track and directly facing the target. FFT of data collected at the 25th data point is shown in Figure 8-2; three peaks represent possible targets at different ranges. However, in the actual tar get scene, only one target is present.
CONCLUSION AND FUTURE PLANS
This thesis presents a scaled synthetic aperture radar system designed for close range (<100 ft ) imaging. Sub-systems described in this thesis include the antenna, RF signal chain, radar movement, LabView, and signal processing. A Vivaldi flare antenna pair was designed, fabricated and tested. This antenna pair was connected to a frequency chirp (1.2 to 2.5 GHz) transceiver. The LabView sub-system controls data collection as well as antenna and RF sub-system movement along a 10 ft guide rail.
The movement sub-system (rail and moving platform) was built using supplies available at home improvement stores. After a full sweep across the rail, signal processing algorithms similar to the Range Doppler Algorithm generate a two-dimensional SAR image of the target scene. Hardware range compression images are presented to summarize system capabilities. This thesis describes major considerations in scaled SAR system development. The thesis by Jason Schray completes the scaled SAR imaging system description.
Source: California Polytechnic State University
Author: Ryan Kristopher Green
>> 60+ Antenna Communication Projects for Engineering Students
>> Antenna Projects using Matlab for ECE Students
>> Antenna Digital Signal Processing Projects for Engineering Students
>> 60+ Smart Antenna Design Final Year Projects for Engineering Students
>> 50+ Matlab projects for Digital Image Processing for Final Year Students
>> More Matlab Projects on Signals and Systems for Students
>> 200+ Matlab Projects based on Control System for Final Year Students